Introduction
Application logging is a critical part of log management and can help keep businesses running smoothly. If you don’t have any proper logging records, it is difficult to identify the events, and it will also consume a lot of time in troubleshooting. That’s why application logging is essential for optimising, monitoring, and troubleshooting your integration solutions. And due to the limitations of the cloud hub, it is difficult to track or monitor the logs after a certain period.
To overcome this, organisations must opt for log aggregation tools. To simplify this process, we have designed a service to publish the logs generated by the Mule application to log aggregators like ELK and Splunk.
What is the Log Aggregation Service?
The log aggregation service was designed to publish the logs generated by the Mule application to log aggregators like ELK and Splunk.
- It is a rest-based service that listens to and publishes the logs to ELK or Splunk.
- Supports different formats to publish the logs.
- Publish the logs based on indexing.
Log Aggregation Utility
Setting up ELK
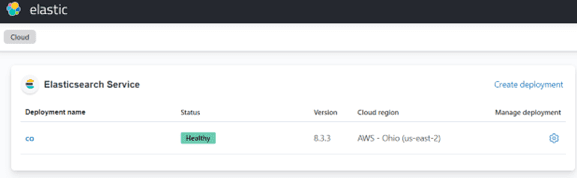
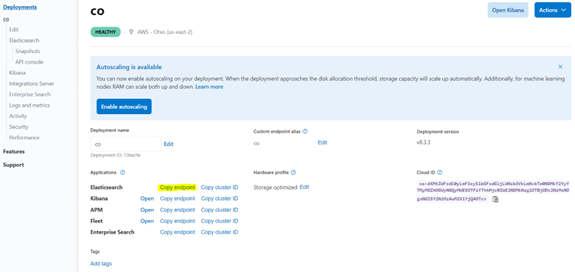
1. Once you have configured your Elk stack, the first step is to create the deployment profile. Once you are done with the deployment profile, you can see the deployment profile below with the deployment status.
2. The next step is to collect the elastic search rest URL. You can find the URL in the deployment profile setting (deployment profile setting -> Elasticsearch Copy endpoint).
Indexing in ELK
- You need to use _doc or _create in order to create the index on Kibana.
- Once you publish the logs with the specific index, e.g., https://co.es.us-east-2.aws.elastic-cloud.com/elkpoc/_doc
- You can view the index in Stack Management/Data/Index Management.
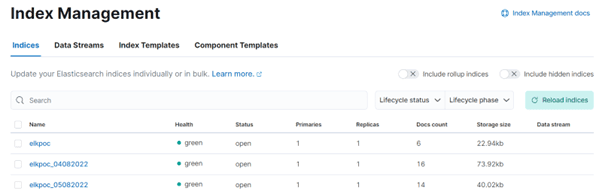
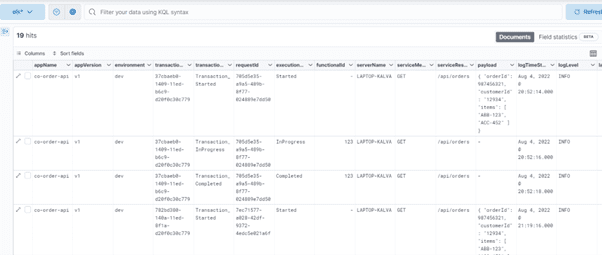
You can filter with the provided index on Kibana. Now you can search, monitor, and troubleshoot the logs.
Log Aggregation Utility Service
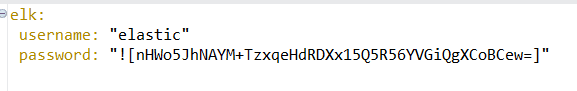
1. Once you have setup your ELK stack, you need to configure the below properties in the log aggregation service.
2. Configure the http request endpoint details of the log aggregation service, publish the logs of your application, and configure the index in the query parameters.
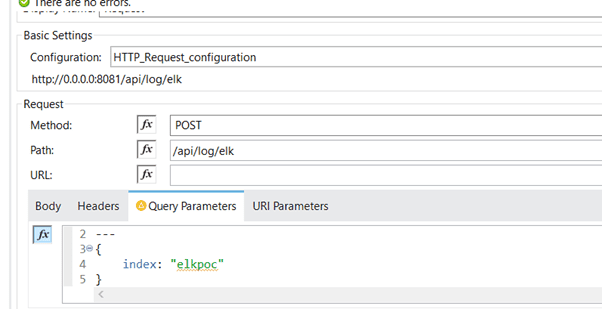
3. Once the call is generated, the log aggregation service will publish the logs to the elastic stack, and the same can be viewed on the Kibana board.